Real Estate & Home
How Much Does Shade Affect Solar Panel Output?
By SunCast team · Published · Last updated · 7 min read · Markdown
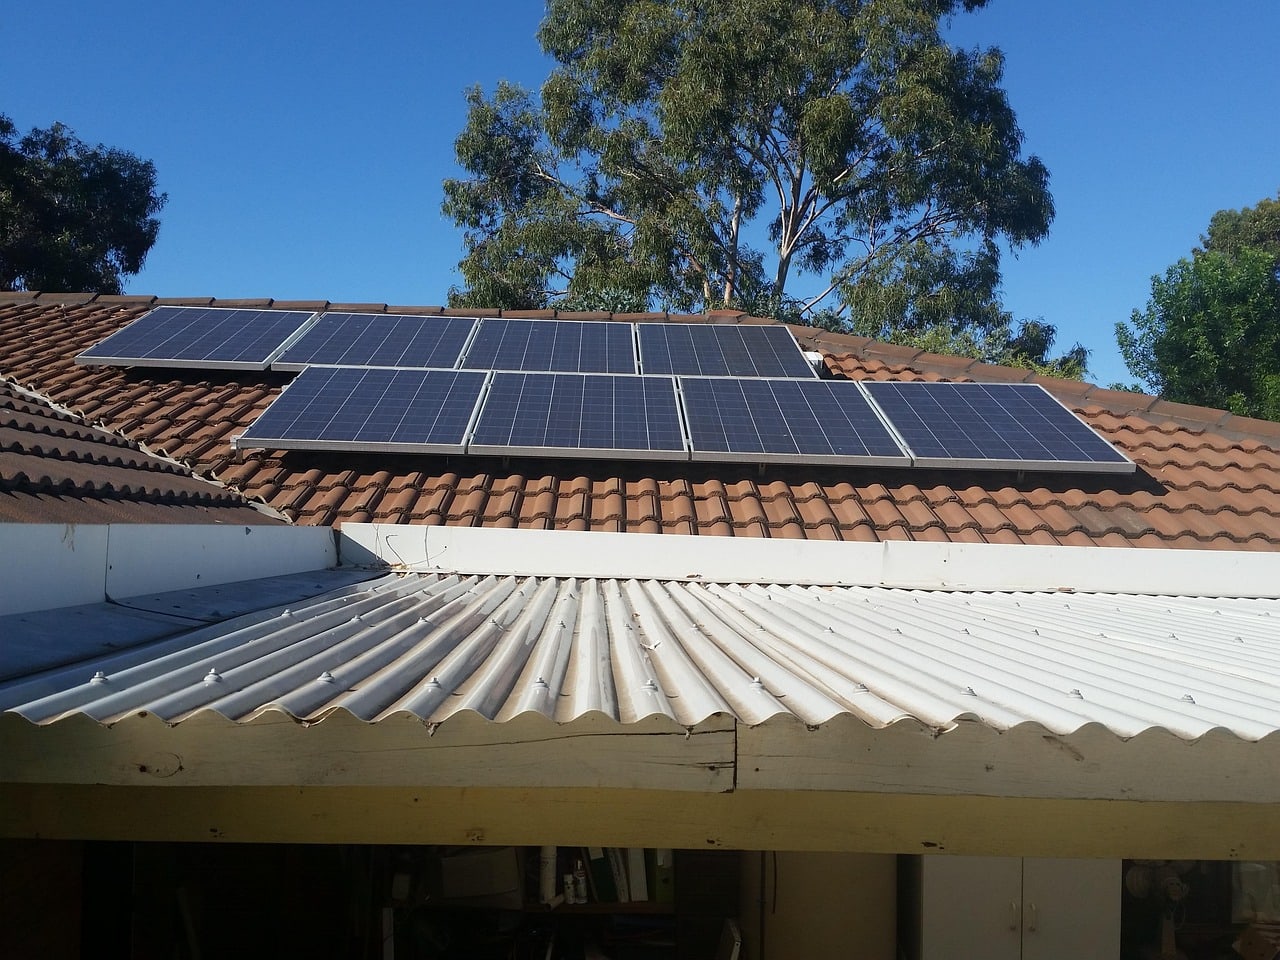
Shade reduces solar panel output, but there is no single percentage that applies to every roof. The loss depends on when the shade arrives, how long it lasts, which cells or panels it covers, and how the system is connected. A photograph of a partly shaded roof cannot establish its annual energy loss.
The useful question is: how much energy would this particular layout lose over the year? A preliminary calculator can compare assumptions. A site-specific shading assessment must establish whether those assumptions fit the roof.
Key takeaways
- The percentage of roof area in shade is not automatically the percentage of electricity lost.
- Shade timing and duration matter alongside its size and position.
- Microinverters and optimisers can help manage mismatch, but cannot replace missing sunlight.
- Treat the calculator’s shade presets as scenarios, not measured losses or guaranteed output.
Compare shade assumptions for your roof
Use the embedded Roof Solar Potential calculator to choose a location and describe the usable roof section. Keep the area, orientation and pitch unchanged while comparing shade settings. That lets you see the effect of the assumption without accidentally changing several inputs at once.
Compare your roof’s shade assumptions
Enter the same roof section under different shade settings and compare estimated production. These are preliminary scenarios, not a measured shading survey.
Choose a search result to start. Browser location is only requested when you press the button above.
Open the full tool →SunCast’s Roof Solar Potential calculator combines location-based PVGIS estimates with usable roof area, direction, pitch and a chosen shade allowance. It is useful for comparing preliminary scenarios and separate roof sections. It does not trace a chimney’s moving shadow, identify shaded cells or model the electrical response of a particular inverter and panel layout.
If you have not established the usable area yet, start with how to estimate roof solar potential. This article focuses on what the shade input means and how to investigate it.
Why does a small shadow sometimes matter more than expected?
Solar modules are part of an electrical system, so their output depends on more than the amount of illuminated roof. Uneven conditions can create a mismatch between connected modules. The effect depends on the equipment and configuration rather than a universal rule that one shaded panel stops every other panel.
The US Department of Energy’s inverter explanation describes how shading on an individual panel can reduce production from a string. It also explains that microinverters operate at individual panels, limiting how a shaded panel affects the power available from others.
A narrow shadow and a broad shadow need not produce losses proportional to their visible areas. Their electrical effects require a model of the actual modules and connections. That is why “ten per cent of the roof is shaded” is not enough information to predict a ten per cent production loss.
Keep these three quantities separate:
| Quantity | What it describes | What it does not establish |
|---|---|---|
| Shaded area | The part covered at a particular moment | Annual energy loss |
| Instantaneous power | Output at that moment, in kW | Electricity produced through the year |
| Annual energy | Production over a year, in kWh | Whether every panel contributes equally |
When the shade arrives matters
A shadow that crosses panels briefly is a different case from one that remains over them for much of the day. Its importance also depends on how much those panels could have generated during the affected period. Counting shaded hours without considering the available solar resource misses that distinction.
Consider two hypothetical roofs. One has a chimney shadow near the end of a winter afternoon. The other has a building obstruction over a roof section during a substantial part of the day. Neither can be assigned a reliable annual loss from that description alone, but the second clearly needs a different investigation from a brief, seasonal obstruction.
For each object that might block light, record:
- Which roof section it affects.
- The approximate start and end of the shaded period.
- Whether the shadow reaches the proposed panels or only unused roof area.
- How the situation changes with the season.
- Whether the obstruction itself changes, such as a tree gaining leaves or growing taller.
Use the Sun Calculator to explore the direction of the sun on different dates. The guide to using a sun tracker for solar planning explains where that preliminary work fits. Sun direction is an input to a shading assessment, not an electrical production model by itself.
What the calculator’s shade percentages actually mean
The current SunCast web calculator applies a simple multiplier to the production estimate. Its central allowances are 0% for no shade, 5% for light shade, 15% for moderate shade and 35% for heavy shade. “Unknown” also uses a 15% central allowance, with a broader displayed range.
Those figures are product assumptions, not measured averages for those labels. They do not mean that every lightly shaded roof loses five per cent, or that a heavily shaded roof will retain sixty-five per cent of its otherwise available output. Actual losses can differ substantially.
Here is a hypothetical comparison using an annual baseline of 5,000 kWh, before this additional shade adjustment:
| Chosen scenario | Central allowance | Illustrative annual result |
|---|---|---|
| No shade | 0% | 5,000 kWh |
| Light shade | 5% | 4,750 kWh |
| Moderate shade | 15% | 4,250 kWh |
| Heavy shade | 35% | 3,250 kWh |
| Unknown | 15% | 4,250 kWh |
These are arithmetic examples: baseline multiplied by one minus the allowance. They are not a forecast for a particular house. The calculator’s displayed ranges are also preset scenario bounds, not statistical confidence intervals from a shading survey.
The same selected multiplier is applied to every month. Consequently, changing the shade setting scales monthly production; it does not reproduce a tree that shades the roof only in winter or a chimney that crosses panels at a particular hour. Keep that limitation in mind when looking at the monthly chart.
Does PVGIS already account for shadows?
PVGIS can account for the terrain horizon, including hills and mountains. Its horizon-profile documentation explains that the terrain calculation does not include very nearby objects such as houses or trees. A location-based estimate therefore should not be read as confirmation that your roof is unobstructed.
The JRC’s calculation documentation separately identifies local partial shading as an effect outside that calculation. SunCast’s broad shade allowance provides a way to explore uncertainty; it does not turn the underlying estimate into a detailed nearby-obstruction model.
The SunCast baseline also uses a 14% PVGIS system-loss input. That is separate from the additional shade multiplier discussed here. If you are comparing an installer’s estimate with the calculator, check which losses each already includes before applying another deduction to the same result.
Will microinverters or optimisers remove the loss?
They can help panels operate under different conditions, but they cannot recover sunlight that never reaches a panel. Their benefit depends on the shade pattern and the proposed system. The presence of shade is a reason to compare designs, not a reason to assume one equipment choice eliminates the problem.
The Australian Government’s inverter guide describes independent panel operation with microinverters and the potential benefits of optimisers for partially shaded systems. It also notes the value of grouping panels with similar sunlight and shading conditions in a string.
Ask the installer to compare the same roof and weather assumptions with the proposed equipment options. Request an explanation of the expected difference, including which shaded modules drive it. The embedded calculator has no inverter-type input, so it cannot make that comparison for you.
A practical five-step shading check
- Mark the proposed panel area. Do not judge shade over the whole roof if panels will occupy only one part. Split differently oriented roof planes into separate sections.
- List nearby blockers. Include chimneys, dormers, trees, adjacent buildings and any known planned structures. Note uncertain dimensions rather than treating guesses as measurements.
- Observe several useful times and dates. Take notes or photographs from an accessible viewpoint. A single midday image cannot represent a changing annual shadow pattern.
- Run consistent calculator scenarios. Keep the other roof inputs fixed, record the selected allowance and compare the results. Leave “Unknown” where you have not established a better assumption.
- Ask for a site-specific design assessment. Compare the proposed layout, shading assumptions, electrical configuration and monthly production before relying on the annual total.
The Department of Energy’s homeowner guide identifies tree cover and roof characteristics as suitability factors and recommends a custom estimate from an installer. Use your preliminary work to make that conversation more specific.
For an existing installation, describe the affected panels and times to the installer and compare like-for-like monitoring data where available. For a new installation, ask whether moving or omitting a persistently shaded section improves the proposed layout. Neither decision follows from a shade label alone.
Start by comparing one roof section in the Roof Solar Potential calculator. Record the assumption beside the result: a transparent estimate you can revise is more useful than an apparently precise number with unexplained shade losses.